
Is your dissatisfaction score telling you the truth?
Most contact centers track DSAT. However, few calculate it correctly. Even fewer use it to fix what is actually broken.
DSAT (Dissatisfaction Score) is the percentage of surveyed customers who rate an interaction negatively. This score shows you exactly where service breaks down.
DSAT = (Number of Dissatisfied Responses ÷ Total Valid Survey Responses) × 100
Research by CEB, which is currently under Gartner, shows that 96% of clients who have undergone difficult processes become disloyal customers, while 9% are loyal clients due to simple processes.
According to Qualtrics, the global economy risks losing $3.8 trillion worth of sales because of poor customer experience.
A wrong DSAT number is costly. You fix the wrong thing while customers walk away.
This guide covers the formula, worked examples, 2026 benchmarks, root causes, and nine ways to cut DSAT. Beyond that, the guide shows how AI turns your contact center from a guessing game into a source of clear answers.
What Is DSAT in Customer Service?
DSAT is a VoC (Voice of the Customer) measure. The DSAT score reflects the number of customers indicating that the experience was bad. Picture it as a smoke detector.
DSAT doesn't reflect overall brand health; it indicates where the fire is burning.
Bottom box scoring is most common. In the 1-to-5 scale, a 1 (Very Dissatisfied) or 2 (Dissatisfied) is considered a DSAT rating. Anything else is not.
Herzberg's Two-Factor Theory: According to Herzberg's Two-Factor Theory, the reason is:
- Hygiene Factors: This is the bare minimum of good things like short wait times, accurate billing, functioning equipment, etc. If this fails, DSAT goes through the roof, while if it succeeds, people feel indifferent to it.
- Motivators: These are the extras, like a warm, helpful agent. They lift satisfaction. But they cannot save a customer whose basic problem was never solved.
In short, DSAT measures the basics. That helps you find friction before customers leave. Related terms include CSAT, Voice of the Customer, and sentiment analysis.
DSAT as the inverse of CSAT and why it is not simply 100 minus CSAT
Many leaders think DSAT equals 100 minus CSAT. However, the math does not work that way.
That shortcut assumes every customer is either happy or unhappy. Real surveys have a neutral middle. Those customers are not angry. They just did not feel strongly.
Here is the proof. Say 100 customers respond:
- 60 pick the top box, so CSAT is 60%.
- 30 pick neutral.
- 10 pick the bottom box, so DSAT is 10%.
In this case, using 100 minus CSAT gives you 40%. That is four times too high. The right math is DSAT = 100 – (CSAT + Neutral).
This technique penalizes your team unnecessarily for indifferent customers who are just fine. This shortcut may lead you to address problems which do not even exist.
There is a connection between the two metrics, but they are not symmetrical.
The DSAT Formula (With Worked Examples)
The formula is simple. However, the hard part is deciding who counts as dissatisfied. That depends on your survey scale. Always keep neutral answers in the total. Removing them inflates your score.
Worked example: the 1-5 scale
You get 1,000 responses. 150 people pick a 1 or 2. 200 pick a 3. 650 pick a 4 or 5. Divide 150 by 1,000. Your DSAT is 15%.
Two quick notes on the table:
- 1-7 Scales: The bottom three points count as dissatisfied, and a 4 stays neutral. You get more detail, but mild frustration can look bigger than it is.
- Thumbs Up/Down: It's quick and simple. On the other hand, voting usually happens only when the article is totally a failure. Consider the rating as an indicator rather than a final decision.
DSAT vs. CSAT vs. NPS vs. CES
This quartet cannot be used interchangeably. They are all different and are measured at different time periods.
Get confused, and you'll end up fixing your call flow with brand loyalty campaigns.
Here is the key link. CES is an early warning for DSAT. Meaning, high effort reliably leads to high dissatisfaction, and then churn. Gartner's Andrew Schumacher says effort predicts loyalty about 40% better than satisfaction does.
That is why a satisfied customer can still leave. The agent was polite, but the process was exhausting. Use DSAT and CES together. One shows the failure. The other shows the friction behind it.
What Is a Good DSAT Score? 2026 Benchmarks by Industry
Here is the hard truth: no universal DSAT benchmark exists. Forrester, Gartner, and the American Customer Satisfaction Index (ACSI) do not publish good DSAT scores. Companies also keep bottom-box results private.
So we use proxies. The ACSI scores industries from 0 to 100. The U.S. average sits near 76 to 78. Scores well below that point to more friction and higher DSAT.
There are some trends worth noting:
- SAAS Is Better Than It Seems: When consumers are dissatisfied, they drop service before a survey even hits their doorstep. The remaining consumers are more satisfied.
- Telecommunications and Insurance Are in Trouble: Billing problems, contract conflicts, and slow claims processing lead to a high level of effort.
- Retail and Finance Dominate: Simple returns and effective mobile applications reduce effort.
Regardless of what the situation is, never invert these numbers. A score of 75 on ACSI does not mean 25% DSAT. Use them for comparison, then establish your own baseline.
The 6 Root Causes of High DSAT
High DSAT is rarely one bad agent. Instead, the cause is usually a broken process. Trace your scores back to these seven causes.
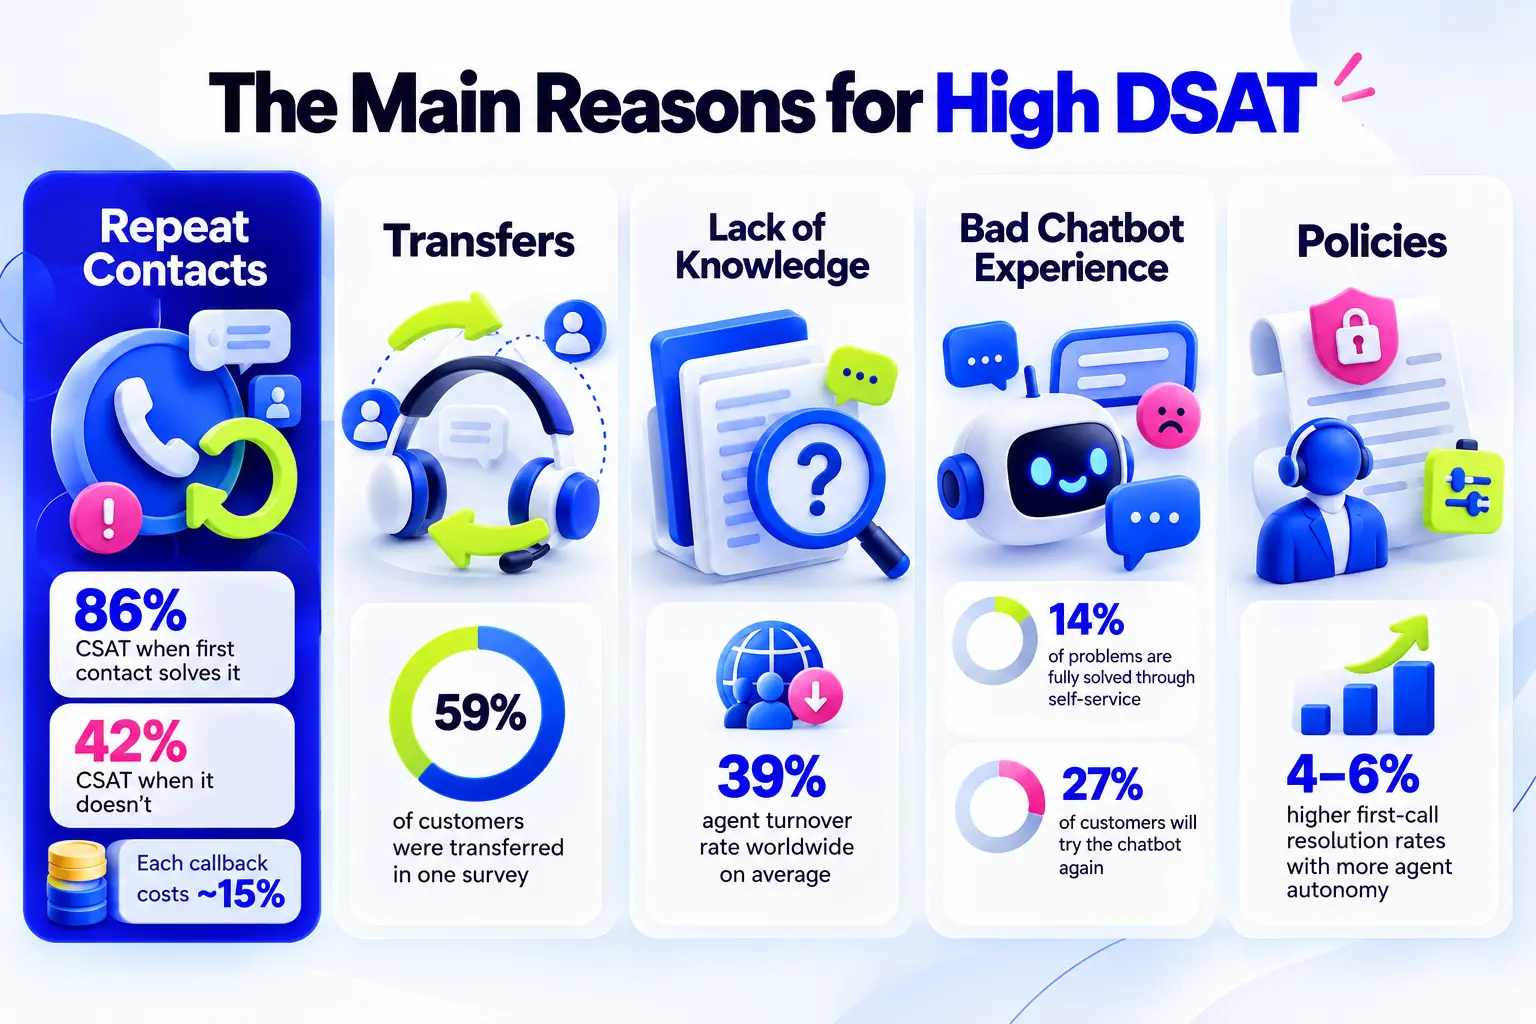
Long handle times, repeat contacts, transfers, knowledge gaps, bad bot handoffs, policy friction, tone
- Repeat Contacts: This is the main cause. On average, customer satisfaction is 86% if the initial contact solves the problem and just 42% if it doesn’t. Each callback costs approximately 15%.
- Transfers: Each and every transfer requires customers to repeat themselves. In one survey, 59% were transferred.
- Lack of Knowledge: The lack of a single go-to resource of answers leaves customers on hold. Agent turnover rates around the world are 39% on average.
- Bad Chatbot Experience: 14% of problems are completely solved through self-service. Moreover, only 27% of customers will try the chatbot experience again.
- Policies: Strict policies make agents ask a supervisor even for a small refund. Granting more autonomy to agents increases first-call resolution rates by 4 to 6%.
- Empathy and Tone: A harsh tone escalates a small issue into a grievance. Customers can see respect and lack thereof.
Do you see the pattern? The majority of these are systems issues. Addressing the system means addressing the score.
9 Steps to Improve Your DSAT
Start with process improvements. Then layer on AI and customer service automation to identify the things humans miss. Together, they ensure DSAT becomes less of a trailing score and more of a real-time metric.
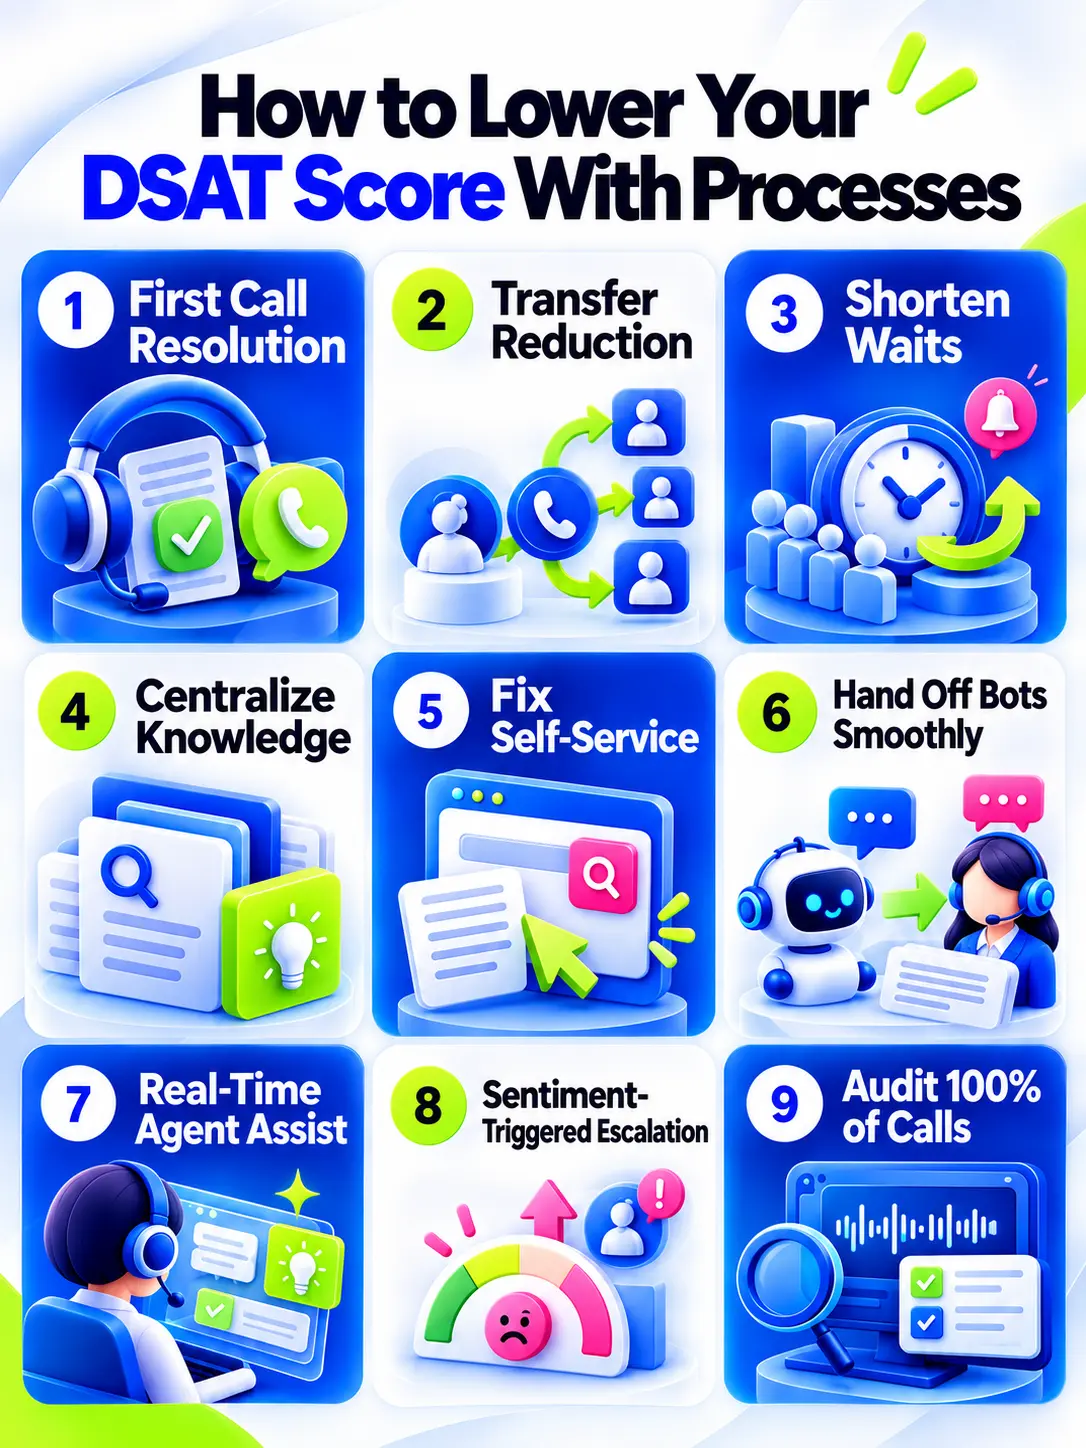
Process improvements that lower friction
- First Call Resolution: SQM Group reveals that each 1% improvement in FCR results in 1% higher customer satisfaction and 1% lower operational costs.
- Transfer Reduction: Implement intent-based routing to ensure callers connect to the right specialist at their first attempt.
- Shorten Waits: Offer callbacks and virtual queues instead of hold music. Match staffing to peak volume.
- Centralize Knowledge: Give agents a single source of truth. A strong knowledge base can lift resolution by 8 to 12 points.
- Fix Self-Service: Check zero-result searches each week. Write articles in your customers' own words.
- Hand Off Bots Smoothly: Add a one-click talk to a person button. Pass the full transcript so no one repeats a story.
Also give agents power to act. Let Tier-1 staff approve small refunds without a supervisor. In this case, policy friction disappears fast.
AI-powered tactics: 100% call auditing, real-time agent assist, sentiment-triggered escalation
- Real-Time Agent Assist: AI listens live and puts the right policy on the agent's screen. No hold time. Conversation intelligence can cut after-call work by up to 33%.
- Sentiment-Triggered Escalation: AI spots rising tension in a customer's voice and alerts a supervisor mid-call. You save the customer before the survey ever goes out.
- Audit 100% of Calls: In Observe.AI research, raising QA coverage from 0.1% to about 19% cut agent fail rates by 20%.
How to Track DSAT at Scale (Beyond Survey Response Bias)
Surveys alone give you a partial picture. To see the full one, you need to score what customers actually do and say.
Why survey-only DSAT understates the problem
- Low Trust: Only 16% of customers strongly believe their feedback drives action, so most never reply.
- Silent Churn: After a 45-minute hold, few people take a survey. They just leave. Your results skew positive.
- Extreme Responses: People answer when they are thrilled or furious. The neutral middle goes missing.
- Survey Fatigue: Drop-off climbs sharply once a survey runs past seven or eight minutes.
AI-scored interactions on 100% of contacts
Manual call audits review only 1% to 2% of calls.. Voxjar's analysis shows that is a prevalence estimator, not an incident detector. This method can estimate your average quality. However, it cannot catch a single breach or churn threat. Meaning, you miss 98% of interactions.
AI changes that by reading your voice tone, interruptions, cross-talk, negative words, and long pauses on every call. The result is a shadow DSAT score built on behavior, not survey replies.
To put it to work:
- Score Every Contact: Use call scoring to track implied dissatisfaction next to your survey DSAT.
- Split by Resolution: Compare scores for solved and unsolved issues to find repeat-call drivers.
- QA Analysts Time: Have analysts examine the worst 5% of calls according to the AI rather than randomly chosen calls.
- Feedback Loop Closure: Inform disgruntled customers about changes resulting from their feedback.
Frequently Asked Questions
Is DSAT 100 minus CSAT?
Not really. Neutral ratings lie between the two values. When CSAT is 60% and 30% are neutral, then DSAT what depends on your particular case. There are no public DSAT benchmarks available. However, if you want to use something as a comparison point, take into account ACSI scores and set your baseline by channel, type of issue and teams. It is the trend that counts.ill be 10%, not 40%. Remember that bottom box answers must always be divided by total valid answers
What is a good DSAT score?
There’s no single answer. Public sources do not publish DSAT benchmarks. That said, you can use ACSI scores as a rough guide, then set your own baseline by channel, issue type, and team. A steady decline matters more than one number.
How do you calculate DSAT on a 1-5 scale?
Simply tally the scores of 1 and 2. Then, divide it by the total number of valid answers, which includes even the neutral 3 score. Multiply it by 100. If there are 150 responses in the bottom box among 1,000 respondents, DSAT is 15 percent.
How is DSAT different from CES?
DSAT tells us if the customer is unhappy, whereas CES tells us about the effort put forth by the customer to seek help. Since efforts are always made first, CES is usually an early indicator of DSAT.
How can AI reduce DSAT?
AI helps in three ways. First, it gives agents live answers so customers skip the hold. Next, it flags angry callers so supervisors can step in. Finally, it scores 100% of interactions, so you see the exact behaviors that drive bad scores.
Why do surveys understate DSAT?
Angry customers often leave without replying. Trust in surveys is also low, and long surveys get abandoned. The people who do answer tend to be the very happy or the very upset. That leaves gaps in your data.