
Is your workforce management team tracking agent occupancy as a single daily average?
That number is known as agent occupancy and is often lying to you…
It’s also the reason why many contact centers swing between burning out agents and bleeding idle payroll without understanding the cause.
Meaning most staffing corrections arrive too late.
This guide breaks down the agent occupancy formula, shares 2026 benchmarks by channel and industry, and shows how to fix occupancy without destroying your workforce.
What Is Agent Occupancy?
Agent occupancy is the percentage of time agents spend handling customer interactions compared to the total time they are logged in and available to receive work.
When an agent logs into your CCaaS platform their time splits into two states: actively handling a customer or sitting idle. Too low and the business pays for idle labor. Too high, and the workforce cracks under pressure.

What Qualifies as Call Activity: Talk Time, Hold Time, After-Call Work
- Talk Time: Time during which the representative interacts with the customer directly to resolve issues or process requests.
- Hold Time: Though hold time increases AHT, it’s also looked at as productive time since the agent is still working.
- Post Call Work: The process of note-taking and updating the CRM following the call comes under post-call work.
The total of all three becomes the numerator of the occupancy ratio.
What Occupancy Excludes: Breaks, Training, Meetings, Coaching
Agent occupancy only measures time in the queue. Breaks, lunches, training, coaching, compliance training, down time of the system are all left out of both the denominator and the numerator.
This is done to ensure that occupancy truly reflects workload concentration while the agent is working on contact management.
Why Occupancy Is a Capacity Metric Not a Performance Metric
Agents control their handle time and schedule adherence. They do not control call arrival rates or staffing levels.
Occupancy is a mathematical output driven by the ratio of demand to staff. Penalizing agents for this metric is a fundamental misunderstanding of queuing theory. WFM planners own it.
The Agent Occupancy Formula
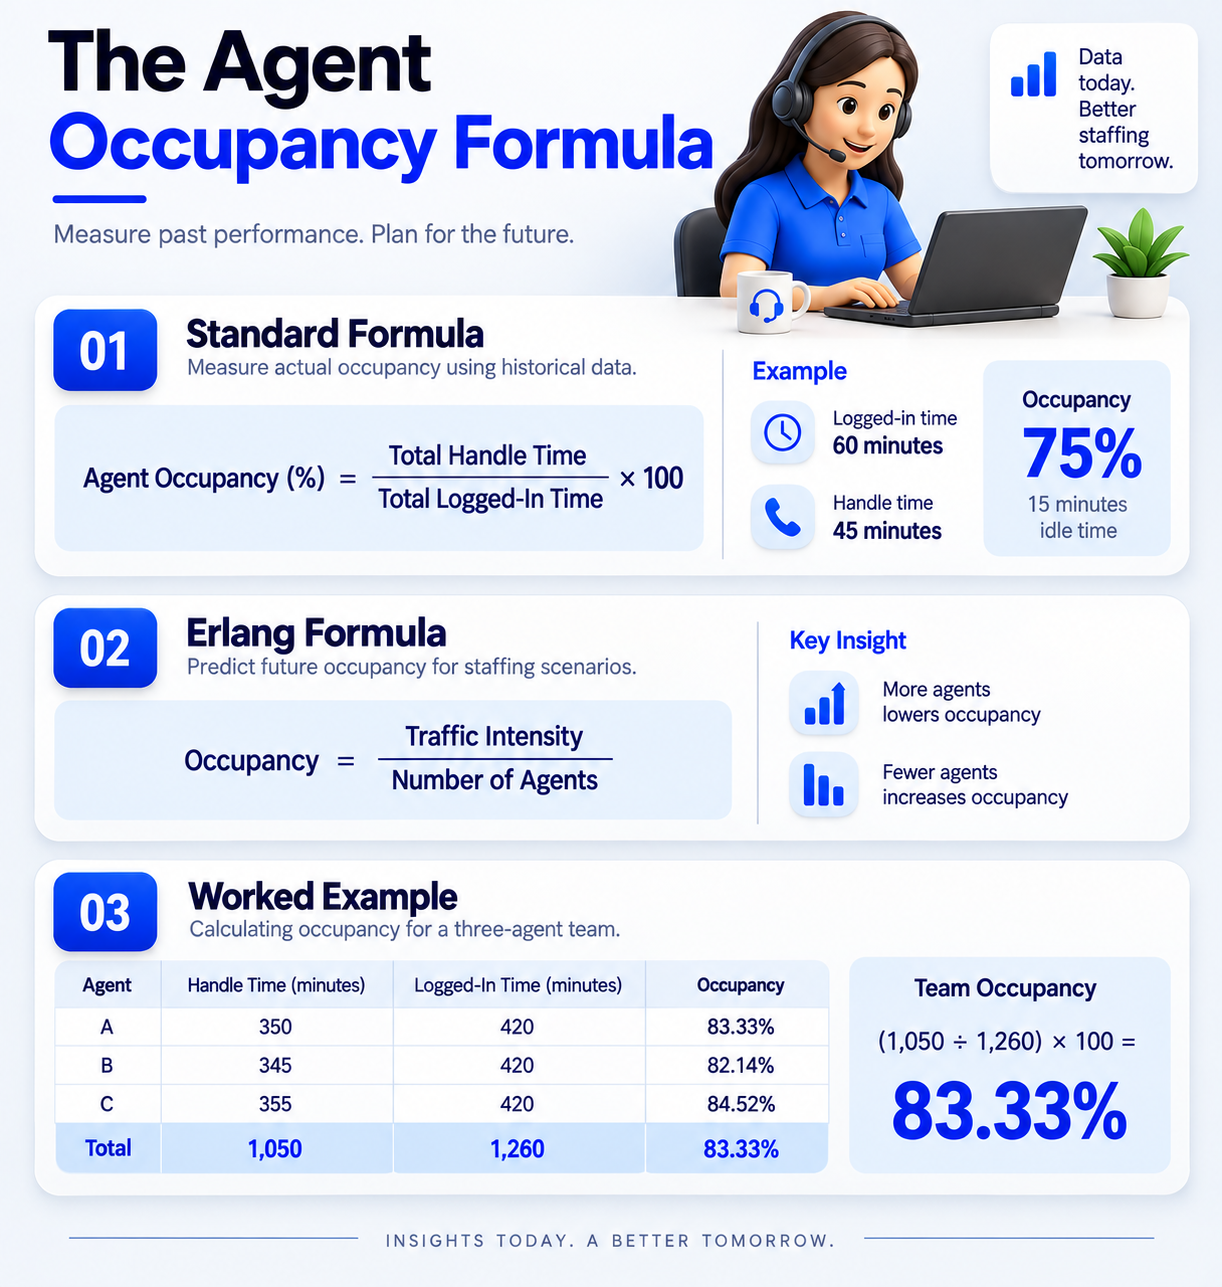
The math works two ways. Look backward at historical data to see how busy agents were. Or look forward using predictive models to plan staffing scenarios.
1. The Standard Formula: Handle Time ÷ (Handle Time + Available Time)
Agent Occupancy (%) = (Total Handle Time ÷ Total Logged-In Time) × 100
An agent logs in for 60 minutes and spends 45 minutes talking, holding and wrapping up. Their occupancy is 75%. The remaining 15 minutes are idle time waiting for the routing engine to deliver the next contact.
2. The Erlang Formula: Traffic Intensity ÷ Raw Agents
Predicting future occupancy uses the Erlang C formula. Multiply call arrival rate by average handle time to get traffic intensity then divide by scheduled agents:
Occupancy = Traffic Intensity ÷ Number of Agents
More agents drops the rate. Fewer agents pushes it up. The agent on the phone controls neither variable.
Worked Example: Calculating Occupancy for a Three-Agent Team
Three agents work the same shift. Agent A handles 350 minutes in 420 logged-in minutes. Agent B handles 345. Agent C handles 355. Aggregate: 1,050 handling minutes across 1,260 logged-in minutes.
Team Occupancy = (1,050 ÷ 1,260) × 100 = 83.33%
How to Calculate Agent Occupancy in Excel or Google Sheets
- Enter Total Handle Time in cell A2, and enter Total Logged-in Time in cell B2.
- Use =A2/B2 in cell C2 and set to percentage. Beware: Time is usually exported by CCaaS systems as HH:MM:SS, which is then read as a time by spreadsheet programs.
What Is a Good Agent Occupancy Rate? 2026 Benchmarks
The ideal target for a standard inbound contact center is about 83%, even though different benchmarks apply based on the channel, complexity, and size of the group.
Why the Benchmark Ranges between 75% and 95%
- Higher levels of premium service aim for 75% to 80% because of the high cognitive load per call. BPOs (outsourced) for transactional inquiries go up to 90% to 95%.
- Consistent voice occupancy over 85% is strongly discouraged by WFM (workforce management) professionals, as it is the maximum before quality becomes substandard and attrition rises.
Benchmarks by Channel: Voice, Chat, Email and Back Office
- Inbound Voice: 80% to 85% max 90%. Exceeding 85% eliminates recovery time between live calls.
- Live Chat: 85%-100% since the agent manages 2 to 4 chats at once so any downtime on one chat can be occupied by typing another.
- Email/Back Office: 90%-100%. There is no stress of incoming queue with asynchronous tasks.
- Social Media: 70%-85%. Public interaction requiring reputation management needs a moderate amount of moderation.
Benchmarks by Industry: BPO, Healthcare, Financial Services, Retail
- Healthcare: 70% to 80% makes sense since sensitive personal data is involved, HIPPA compliance, and the high emotional factor mean that a longer wrap-up is needed.
- Financial Services: 75% to 85% is ideal for the investigation of fraud, and since ID verification can require a lot of cognitive effort.
- Retail and E-commerce: 80% to 90% for its transactional nature allows for quick context switching.
- Outsourced BPO: 85% to 90%. Here, the tight margins and SLAs are what drive occupancy to the highest sustainable levels.
Why Small Teams Cannot Reach the Same Occupancy As Large Teams
A team of 10 people experiences significant volatility in call arrival rate because of their randomness.
In order to meet the 80/20 Service Level, small teams need to schedule more capacity than they need, and often reach 70% to 75% occupancy.
A team of 500 agents benefits from economies of scale. Huge volume smooths out arrival rate allowing for 85% to 90% occupancy and still meeting the Service
Agent Occupancy vs Utilization vs Shrinkage vs Adherence
These four metrics are related but fundamentally different. Confusing them leads to flawed planning and toxic performance management.
Occupancy vs Utilization: What Each One Actually Measures
The difference is the denominator. Occupancy measures busyness while logged in and available.
Utilization measures productive time against the entire paid shift including meetings and training. An agent could hit 90% occupancy but only 65% utilization because three hours went to a compliance seminar.
Where Shrinkage and Schedule Adherence Fit In
Call center shrinkage is the percentage of paid time the workforce is unavailable for contacts including vacations, breaks, sick days and outages.
Schedule adherence measures whether the agent is in the correct state at the time the WFM schedule dictates. Poor adherence disrupts the Erlang math causing unexpected occupancy spikes for everyone else.
How Occupancy Interacts with AHT, Service Level and Abandon Rate
Push service level higher and you need more agents which drags occupancy down. Cut staffing to force occupancy up and wait times extend.
Customers abandon. Exhausted agents inflate ACW to steal rest driving up AHT. Higher AHT increases traffic intensity which pushes occupancy even higher. The cycle feeds itself.
The Four Combinations of High and Low Occupancy and Utilization
- High Occupancy + High Utilization: Non-stop calls for the full shift. Severe understaffing. Turnover follows fast.
- High Occupancy + Low Utilization: Slammed when logged in but too much offline time. Cancel shrinkage during peaks.
- Low Occupancy + High Utilization: Agents at desks but phones silent. Forecasting failure. Wasted payroll.
- Low Occupancy + Low Utilization: Agents absent and demand low. Overhaul attendance and forecasting.
What High Occupancy Really Costs You
Running the floor at 90% to 95% looks financially optimal on a spreadsheet. The downstream consequences rapidly erase any upfront savings.
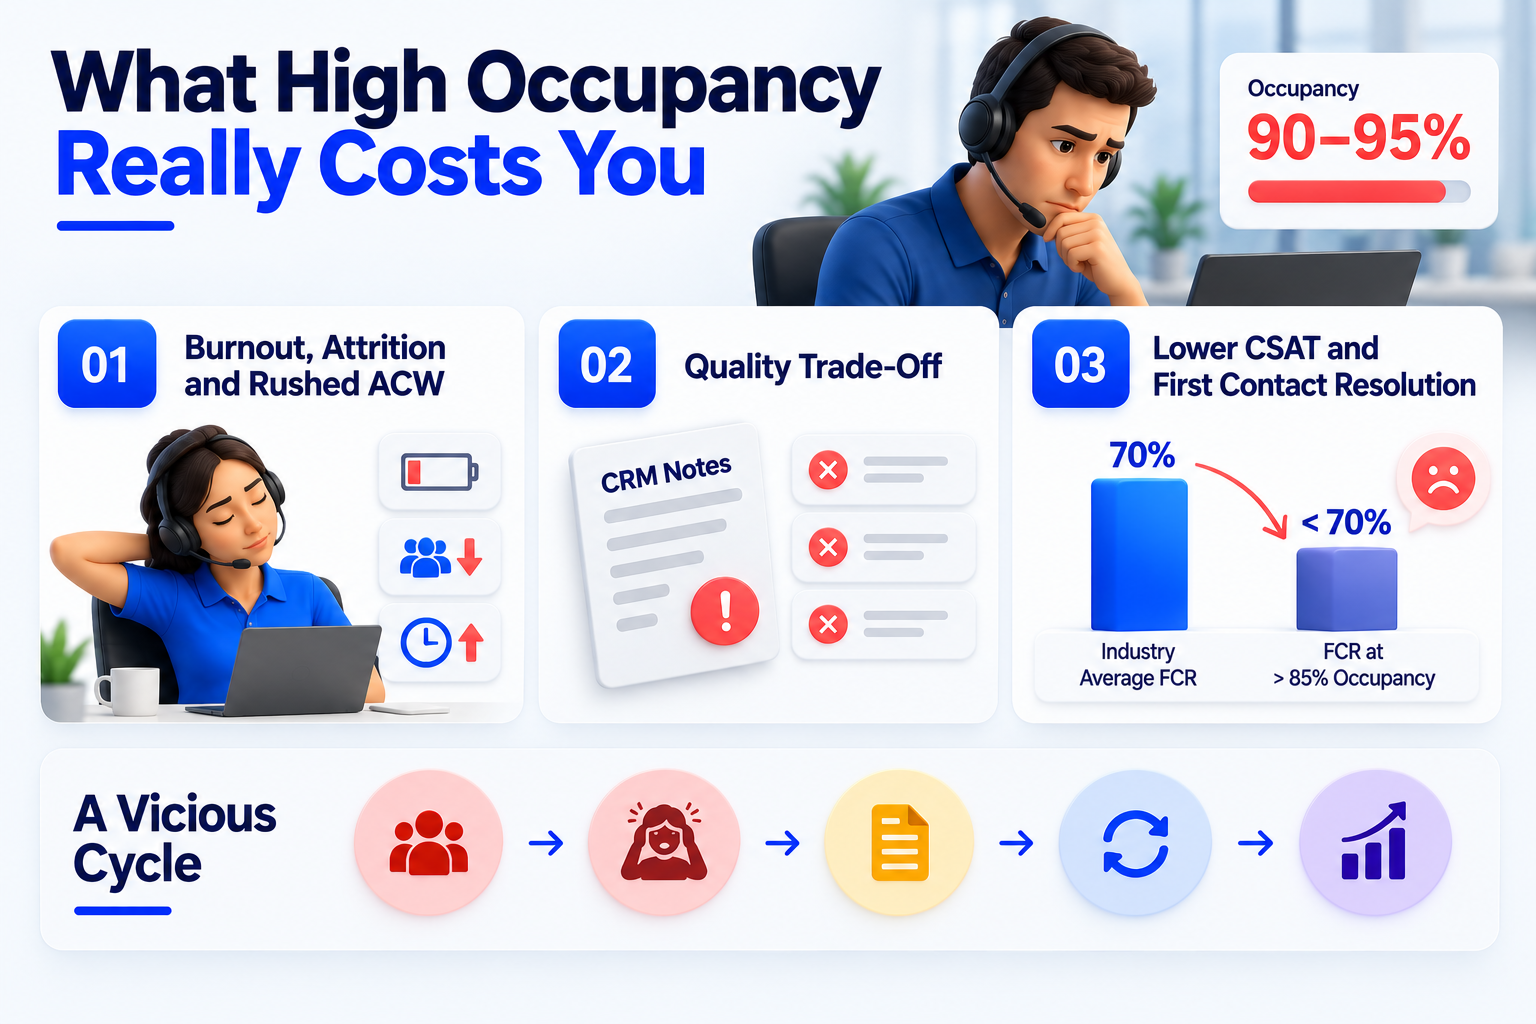
1. Above 90%: Burnout, Attrition and Rushed After-Call Work
At 90% occupancy, an agent faces 432 minutes of continuous engagement with only 48 minutes of idle recovery across an entire day. The result is burnout, absenteeism, and attrition.
Replacing one agent costs thousands in recruitment and onboarding. To escape back-to-back calls, agents artificially extend ACW, forcing the system to withhold the next call, which distorts AHT analytics.
2. The Quality Trade-Off: Shortened Wrap-Up, Incomplete Notes, Repeat Contacts
If leadership responds with rigid wrap-up timers, pressure shifts to quality. Agents abandon thorough documentation. CRM notes go missing.
When the customer calls back, the next agent lacks context, driving up handle time and damaging the brand.
3. How Occupancy Pressure Surfaces in CSAT and First Contact Resolution
Agents under pacing pressure prioritize ending the call over solving the problem. As occupancy crosses 85% FCR drops well below the 70% industry average.
Unresolved issues generate repeat contacts, which inflate volume and push occupancy higher. High occupancy structurally guarantees a flood of failure demand.
What Low Occupancy Signals
Overstaffing, Forecast Error and the Cost of Idle Time
Occupancy below 65% for inbound voice signals the queue is massively overstaffed.
This stems from a WFM forecasting breakdown or an emotional over-correction to a previous service level failure where management flooded the floor and abandoned the math.
Why Daily Average Occupancy Lies
A single daily number is one of the most deceptive statistics in your operation.
I. Measuring Occupancy at the 15- and 30-Minute Interval
An 80% average per day might well conceal 98% morning crisis within 50% afternoon slack.
Occupancy in the morning peak, between 9:00am and 11:00am, may kill the service levels. Occupancy in the afternoon slack, between 2:00pm and 4:00pm, also will.
II. Reading an Interval Heat Map: Peaks, Troughs and Blended Averages
Blue blocks signal overstaffing below 70%. Green blocks signal optimal pacing between 75% and 85%.
Red blocks signal understaffing above 90%. If the period after lunch is consistently red, stagger the schedules. Blue troughs highlight windows for deploying training or coaching safely.
How to Improve Agent Occupancy Without Burning Out Agents
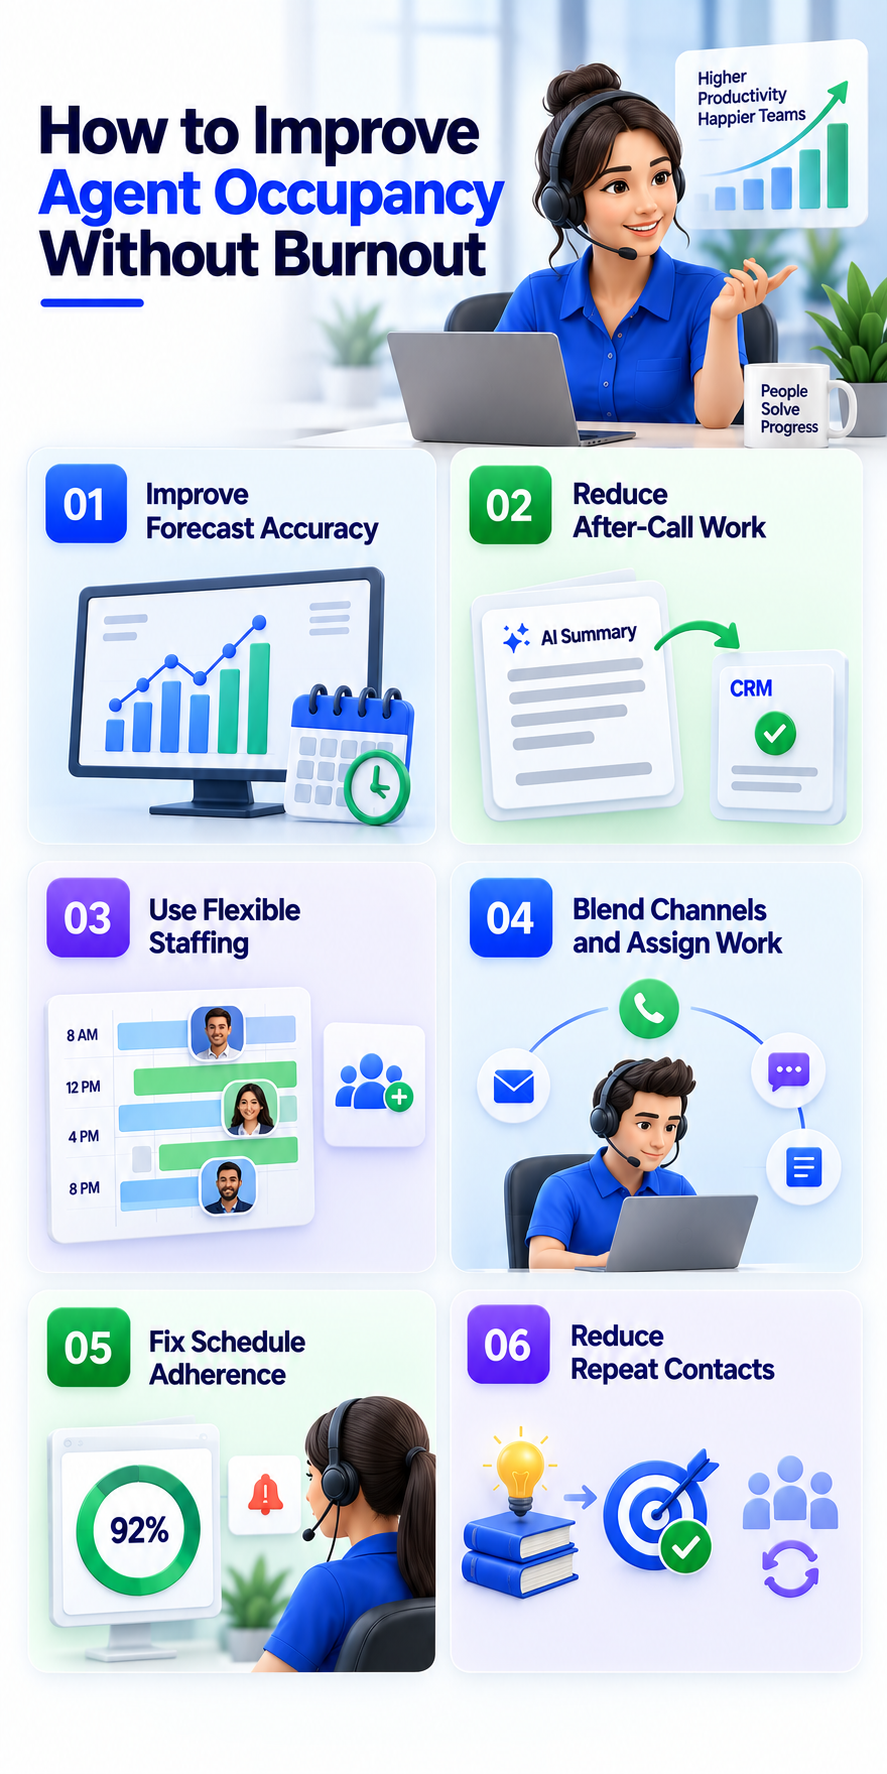
The goal is not to make agents work faster. It is to reshape the environment and routing logic so demand peaks flatten and staffing troughs fill.
1. Tighten Forecast Accuracy and Interval-Level Staffing
Use Erlang C calculators and AI-driven models to forecast volume and AHT at the 15- or 30-minute interval.
Match the scheduling curve against the expected arrival curve to keep occupancy in the 80% to 85% zone dynamically throughout the day.
2. Cut After-Call Work with Automated Summaries and CRM Updates
ACW counts as handle time so reducing wrap-up directly decreases traffic intensity.
Tools like Thunai use generative AI to produce automated call summaries and trigger CRM workflows cutting 2 to 4 minutes per interaction.
The agent returns to available faster stabilizing occupancy without increasing conversation pace.
3. Flexible Staffing and Part-time Staffing for Peak Intervals
If heat maps show spikes, then use part-time staff during 4-hour peak intervals.
Employ split shifts or micro-block overtime opportunities to agents who are working from home if math dictates.
4. Blend Channels and Use Deferrable Work to Fill Troughs
When voice drops below 70% the routing engine should push emails, social media or back-office tickets to idle agents.
This maximizes payroll value while keeping a steady workload.
5. Fix Schedule Adherence and Unplanned Absence in Real Time
A perfect forecast fails if agents do not follow it. If multiple agents extend breaks simultaneously occupancy rockets for the rest of the floor.
Automated alerts let supervisors correct deviations before damage spreads.
6. Reduce Repeat Contacts by Raising First Contact Resolution
The most sustainable long-term fix. Empower agents with knowledge bases, remove restrictive AHT targets and implement QA focused on resolution.
Thunai Reflect monitors agent health constantly surfacing the insights supervisors need to coach toward resolution. Eliminating failure demand shrinks the Erlang load and brings occupancy down naturally.
How AI Deflection Changes Your Occupancy Math
Agentic AI and conversational IVRs have rewritten capacity planning and the baseline metrics WFM relies on.
What Happens to Occupancy When AI Agents Absorb L1 Volume
An AI layer like Thunai Omni absorbs 40% to 60% of Tier 1 volume including password resets, order tracking and basic billing.
The AI runs at 100% occupancy with infinite concurrency. If human staffing stays flat occupancy collapses into the 40% to 50% range creating severe payroll waste.
Rebasing Targets When the Remaining Contacts Are More Complex
AI deflects the easy work. Human agents now handle only high-friction escalations and retention saves. AHT climbs organically.
An 85% target that was sustainable for simple queries causes rapid burnout when every call is complex. Target human occupancy must drop to 70% to 75%.
Tracking Human and AI Capacity in a Single Model
Progressive WFM teams model AI and human labor inside one forecasting system. AI bots are treated as a scheduling pool with infinite capacity and zero shrinkage.
Total forecasted workload is mapped, the AI deflection rate subtracted, and the remaining load passed through Erlang C for the rebased 75% human target.
How to Track Occupancy in Your WFM or CCaaS Platform
Every major platform calculates occupancy but naming and formulas differ slightly across vendors.
Occupancy Reporting in Genesys, NICE, Amazon Connect and Five9
- Amazon Connect: Calculates occupied time divided by occupied plus available time. The GetMetricData API streams agent state data refreshing in near-real-time every 15 seconds.
- NICE CXone: Reports occupancy as available and handled time combined. The Enhanced Strategic Planner uses maximum occupancy as a bounding constraint for FTE forecasting.
- Five9: Represents the metric as (Login Time minus Wait Time) divided by (Login Time minus Not Ready Time) isolating Not Ready states for accurate workload density.
- Genesys Cloud: Standardizes occupancy as handling time compared to total available time. Real-time dashboards trigger routing adjustments when occupancy breaches maximums. Thunai connects via Thunai MCP to add automated auditing and sentiment tracking on top of native reporting.
Want to see how Thunai tracks agent occupancy and all the metrics you need in one central dashboard?
Book a free demo call with our team to see agent occupancy and our live call scoring in action.
Agent Occupancy FAQs
What is a healthy occupancy rate for a call center?
For inbound voice between 75% and 85%. This balances payroll efficiency with enough idle time for recovery. Adjust downward for smaller teams or complex call types.
Is 100% occupancy ever acceptable?
For inbound voice no. It is impossible without infinite wait times and guaranteed burnout. For asynchronous channels like chat or email agents can safely approach 100% because micro-breaks exist between tasks.
Does occupancy include after-call work?
Yes. ACW is a mandatory part of resolving a customer issue. Because the agent is actively engaged in a productive task it is included in the numerator alongside talk time and hold time.
How is occupancy different from utilization?
Occupancy measures workload density while logged in and available. Utilization measures productive time including calls, training and meetings against the entire paid shift. Utilization is driven by shrinkage. Occupancy is driven by call volume and queue staffing.
How do you calculate occupancy for chat and email agents?
The formula stays the same. Because chat agents handle multiple sessions at once the system calculates aggregate engaged time. If an agent runs three chats for 20 minutes that counts as 20 minutes of occupied time allowing digital occupancy to safely approach 100%.
Can occupancy be higher than 100%?
No. An agent cannot spend more time handling interactions than the total time they are logged in. A number above 100% signals a data extraction error, such as counting concurrent chat durations cumulatively rather than chronologically.